
Today I wanted to add MiniProfiler to an ASP.NET MVC web application (not .NET Core), but unfortunately the NuGet package doesn't set up things correctly, the documentation is a bit lacking, and their sample project doesn't work. What was supposedly a simple task, took almost a full day of research to make it work.
In this post, I'm going to explain in 7 easy steps how to install MiniProfiler on an empty ASP.NET MVC web application.
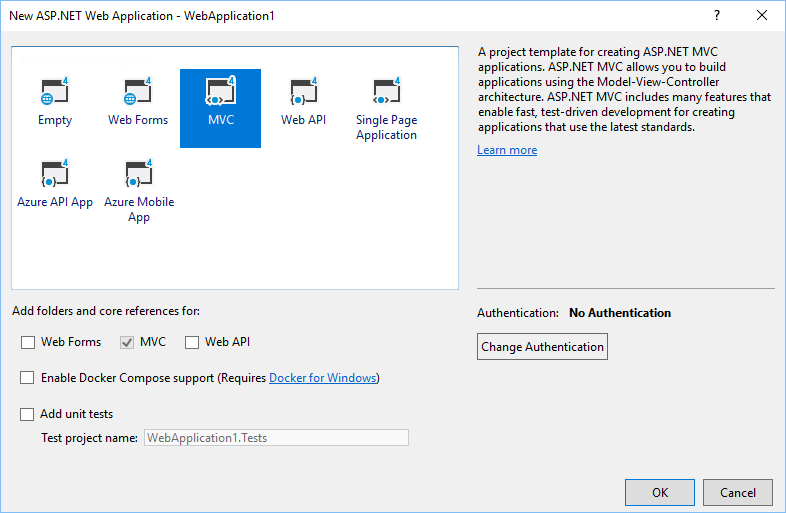
Step 1 - Create an ASP.NET MVC application
To keep things easy, let's start with creating a new ASP.NET MVC application.

Step 2 - Install the MiniProfiler.MVC5 Nuget package
The correct NuGet package to install is MiniProfiler.MVC5, which supplies the core MiniProfiler package and provides the correct integration with ASP.NET MVC.
Install-Package MiniProfiler.Mvc5
Step 3 - Add the minimum MiniProfiler configuration
The configuration happens in the Application_Start, Application_BeginRequest and Application_EndRequest inside the Global.asax.cs file.
Inside the Application_Start you have to add the following line, to set up the default options.
MiniProfiler.Configure(new MiniProfilerOptions());
Moreover, then add the Application_BeginRequest and Application_EndRequest methods to start and stop the tracking at each request.
protected void Application_BeginRequest()
{
    MiniProfiler profiler = null;
    if (Request.IsLocal)
    {
        profiler = MiniProfiler.StartNew();
    }
}

protected void Application_EndRequest()
{
    MiniProfiler.Current?.Stop();
}
Step 4 - Include the scripts in the view
You now need to include the scripts in the views. The easiest way is to add them in Shared/_Layout.cshtml master view.
At the top, add the namespace using declaration @using StackExchange.Profiling; and at the bottom, just before the </body>
    @MiniProfiler.Current.RenderIncludes()
</body>
Step 5 - Configure the site to route all requests as managed code
If you run the site now, nothing happens. The reason is that MiniProfiler relies on a JavaScript library rendered at the moment, and it is requested as .js, so usually it wouldn't be executed as .NET request. So, you have to add the following line in the web.config.
<system.webServer>
   <modules runAllManagedModulesForAllRequests="true" />
 </system.webServer>
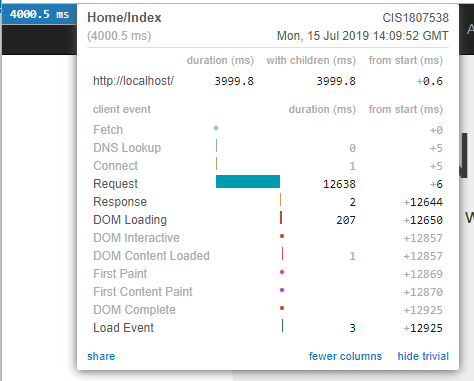
Running now the website you get the MiniProfiler UI in the top left corner of the site, and by clicking you get the execution timings of the page.
Step 6 - Configure to track MVC Controller
The current view is not very useful, as it shows nothing, apart from overall execution. In an ASP.NET MVC application, you can start tracking a bit more information on the execution time of each action, by adding a new filter into the pipeline. Open the FilterConfig.cs file (if you are following along with the basic template) and add this line to the RegisterGlobalFilters method
filters.Add(new ProfilingActionFilter());
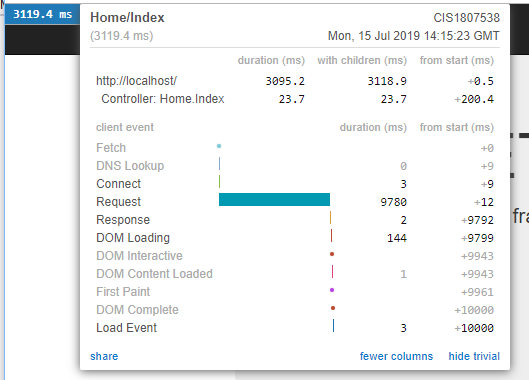
Now, rerun the same site, and you'll also see the execution time of the controller.
Step 7 - Start using it
There is no real step 7... but it's cool to have 7 steps.
Jokes aside, now that the basic configuration is working, you can head to the official documentation to see how to start profiling portions of your code in a way that matters, usually done via the Step and CustomTiming methods.
Here some sample code you could add to your actions to experiment a bit.
public ActionResult Index()
{
    var profiler = MiniProfiler.Current;
    using (profiler.Step("Set page title"))
    {
        ViewBag.Title = "Home Page";
    }

    using (profiler.Step("Doing complex stuff"))
    {
        using (profiler.Step("Step A"))
        {
            // simulate fetching a url
            using (profiler.CustomTiming("http", "GET http://google.com"))
            {
                Thread.Sleep(10);
            }
        }
        using (profiler.Step("Step B"))
        {
            // simulate fetching a url
            using (profiler.CustomTiming("http", "GET http://stackoverflow.com"))
            {
                Thread.Sleep(20);
            }

            using (profiler.CustomTiming("redis", "SET \"mykey\" 10"))
            {
                Thread.Sleep(5);
            }
        }
    }

    // now something that loops
    for (int i = 0; i < 15; i++)
    {
        using (profiler.CustomTiming("redis", "SET \"mykey\" 10"))
        {
            Thread.Sleep(i);
        }
    }

    return View();
}
This code generates the trace shown in the following picture.
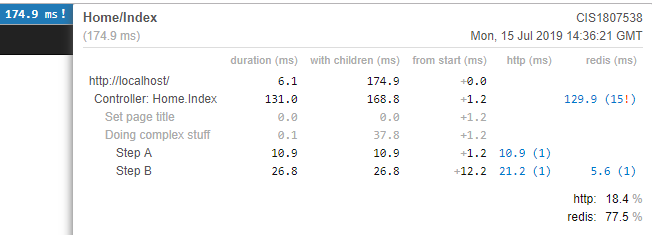
You can notice some interesting information detected by MiniProfiler. It detected that the code is calling the same 15 times (the loop at the bottom of the action method) and how much of the time is spent in different categories of operations (in the example, http and redis).
An additional feature to add would be tracking SQL statements with the EF6 integration.
A word of caution
Miniprofiler might affect negatively the performances of you application, so it's recommended that you run the profiling code only when Request.IsLocal and in debug mode.
Additionally, when the project is deployed in a production environment, you need to remove the line in the web.config that sets runAllManagedModulesForAllRequests to true. This line forces all requests to be treated by the .NET framework, even static files. And this will affect the performances of the site.
If you don't want to deal with web.config transformations, you can also set the handler specifically for the path used by MiniProfiler (as Paul recommended in the comment below):
<handlers>
   <add name="MiniProfiler" path="mini-profiler-resources/*" verb="*" type="System.Web.Routing.UrlRoutingModule" resourcetype="Unspecified" precondition="integratedMode"/>
</handlers>