Earlier today I wrote a post about how to improve the performance of ASP.NET MVC web applications, and I came out with the conclusion that the best way to improve performance is to add data caching and that the rest was not very important.
Rudi sent me an email pointing out that turning the optimization upside down as I asked in my post, the expression tree-based ActionLink method still causes a lot of performance problems, at least in his sample application, a DIGG-like application, where there are 4 calls to the ActionLink helper for each of the 20 items displayed on the page plus some other calls around the page (from a slide of the presentation, it seems like the sample calls the method at least 160 times per page).
So I decided to analyze the results of his performance test better, and it really turns out that, in his context, with hundreds of calls to the ActionLink method, this method is a big performance issue.
Go and have a look at the original presentation, on page 26, to read the reasons why it is so slow.
What are the data really saying?
I based my previous assumptions on the number of requests per second gained, but I missed one important factor: relative gain. Gaining 10 requests with a baseline of 6 is a much better improvement than gaining 25 on a baseline of 60.
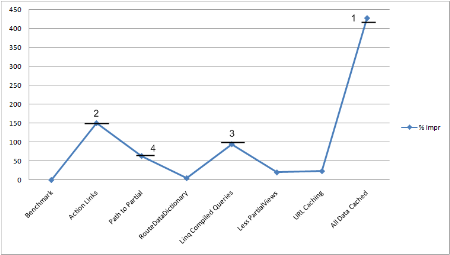
So I created that graphs that help visualize the real relative gain:
The best relative improvement still happens with data caching (a 427% gain), but the second one (150% gain) is using the RouteLink helper specifying the RouteName instead of the lambda expression-based ActionLink helper. The third one is again something related to data (using compiled LINQ queries, with a 94% gain) and then another ASP.NET MVC related issue: specifying the full path to a view is 63% faster (in his scenario where partial views are called 41 times per view) then specifying the view name only. This last one looks strange to me because the RenderPartial method should be caching the path resolution: maybe it’s a bug, or the test was performed with a pre-release version that didn’t cache the result.
UPDATE: Rudi tested everything with the beta version, and since then the WebFormViewEngine caches the resolution of view paths. Furthermore also running in debug mode disables the caching. So this is not a performance issue. Read more about this on my follow-up post: Stopping the panic: how to improve HtmlHelper.RenderPartial performances. Don’t run in debug mode
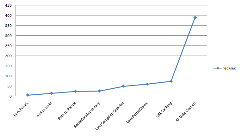
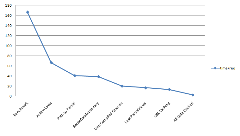
Analyzing one of the other two graphs would have lead to the wrong conclusion: the req/sec was emphasizing the gain provided by the data caching too much, and the time per request emphasizes too much the gain caused by not using the expression tree based method:
What do we get from this?
Number 1 - a correct data visualization is the key to understanding the problems better.
Number 2 – Data caching is still the most effective way to improve the performance of a data driven application.
Number 3 - the expression tree based ActionLink helper has some performance problems.
Number 4 - if the test was performed on the RTM, there is a bug in the caching of view path resolution.
What can you do to to help your performance?
Implementing a route resolution cache, might boost the performance of all the url generation story, and I think that this is something Microsoft should look at for a next version of the routing engine.


