
I've been using Firebug since a few months and I really love it: it allows you to inspect the HTML, to look at the CSS applied to an element and where each single attribute has been set, to visualize the box around each element, to debug JS, to view the JS stack trace, to change the CSS directly on the page. If you never used it, I really suggest having a look. A must in the web developer toolbox.
But today I found another interesting feature, that is not well advertised on the Firebug website: XmlHttpRequest debugging.
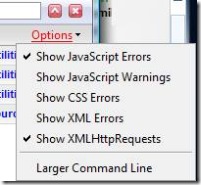
To enable it just open the options menu at the right, and select Show XmlHttpRequests.
From now on, every time your page makes an XmlHttpRequest, you can see in the console panel the requested url, the time taken, all the headers sent and received, the request made (if the it was a POST) and the response received.
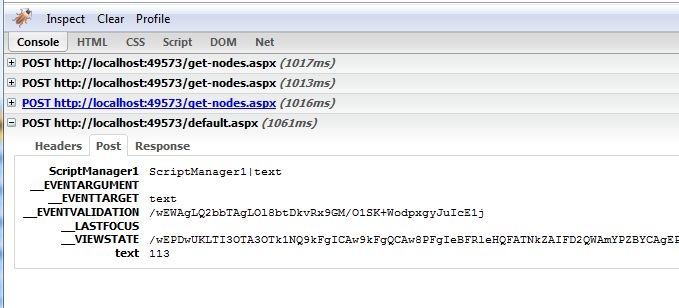
In the screenshot you see the request made by an asynchronous trigger to refresh the contents of an UpdatePanel, with all the parameters sent by the ASP.NET page.